How to Analyze CSV Files With AI Without Exposing Sensitive Data
- November 11, 2026
- 1
To analyze CSV files with AI, start with a synthetic sample or a summary you made locally. If the tool needs individual rows, remove sensitive columns from a

To analyze CSV files with AI, start with a synthetic sample or a summary you made locally. If the tool needs individual rows, remove sensitive columns from a
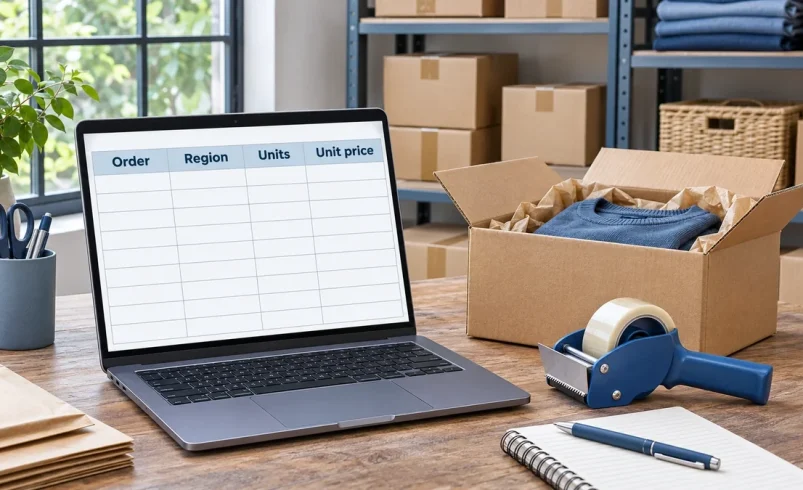
To analyze CSV files with AI, start with a synthetic sample or a summary you made locally. If the tool needs individual rows, remove sensitive columns from a copy, use an approved account, and check the results with your own formulas before sharing them.
A CSV stores table rows as comma-separated values. If your analysis feeds a recurring report, see our workflow for drafting weekly reports from verified figures.
This guide uses official product and privacy documentation checked on November 8, 2026.
Before you analyze CSV files with AI, decide what it needs to see. Invented rows are enough to test a formula. Checked monthly totals are enough to draft a chart.
Before you send any row-level data:
Tokens reduce exposure, but combinations of other fields can still identify someone. If rows remain too revealing, work locally. NIST guidance on de-identification.
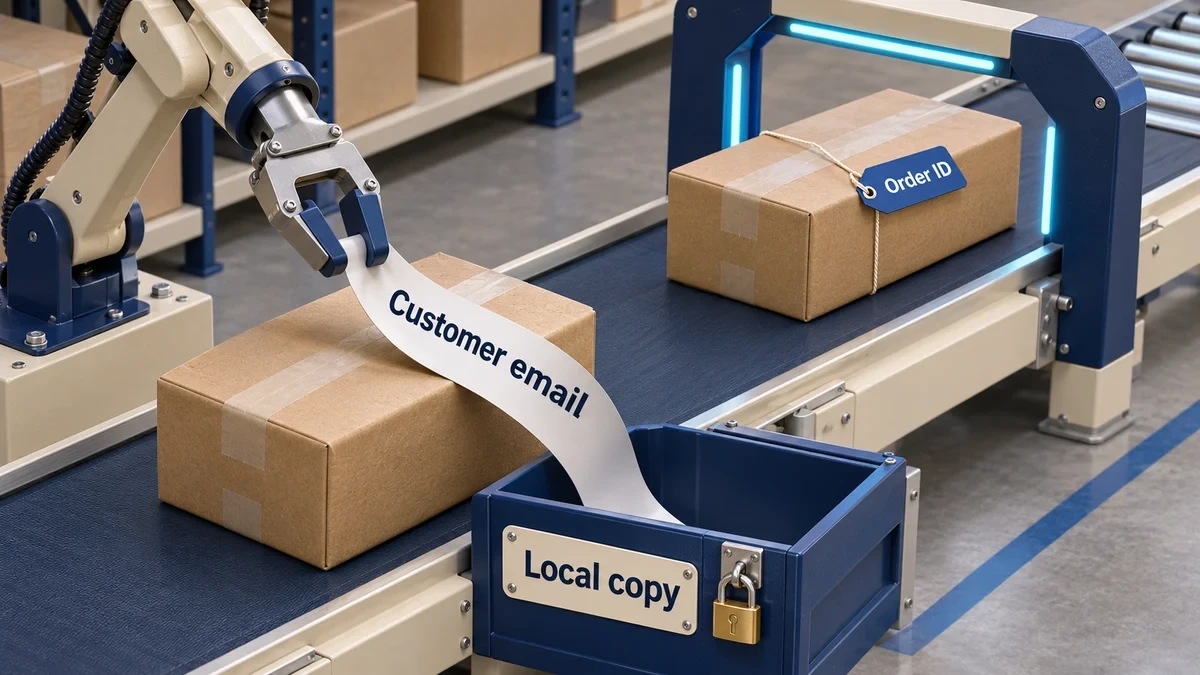
In this hypothetical example, a shop wants gross sales by region in U.S. dollars before tax, discounts, or refunds. After removing customer email, it has six fields in order: order ID, date, region, product, units, and unit price.
Each order in this file has one product line. However, an order ID can legitimately appear on several lines in other exports.
|
Order ID |
Date and Product |
Region |
Units × Unit Price |
|
A101 |
Oct 5 · Tote |
North |
2 × $20 |
|
A102 |
Oct 5 · Bottle |
South |
1 × $30 |
|
A102 |
Oct 5 · Bottle |
South |
1 × $30 |
|
A103 |
Oct 6 · Notebook |
Blank |
3 × $10 |
|
A104 |
Oct 7 · Mug |
North |
2 × $15 |
|
A105 |
Oct 7 · Mug |
South |
1 × $1,500 |
|
A106 |
Oct 7 · Tote |
North |
Blank × $20 |
First, check the row count and how the tool read dates and numbers. Use those checks at the start of any AI data analysis.
Count the data rows, excluding the header. List the column names, inferred types, and date range. Treat order IDs as text. Show examples of blank or invalid values and report any rows that failed to parse. Leave the data unchanged.
You should see seven data rows spanning October 5–7, 2026. If the tool returns fewer, check the import, any filters, and the selected range before moving on. Treat an unsupported explanation for the difference like any other confident but incorrect AI answer.
Use AI for data cleaning, then approve the rules. Here, remove one copy of A102 because the rows match exactly. Keep A103 under Unassigned because its sales amount is calculable. Set A106 aside because its unit count is missing.
List exact duplicate rows and separately flag any IDs repeated on different rows. Keep one copy of exact duplicates for this file. Group blank regions as Unassigned. Set aside rows with missing units or price. Return a change log with row counts and IDs. Leave numeric outliers untouched.
Leave A106 unresolved, because filling the blank with zero would make it a zero-dollar sale.
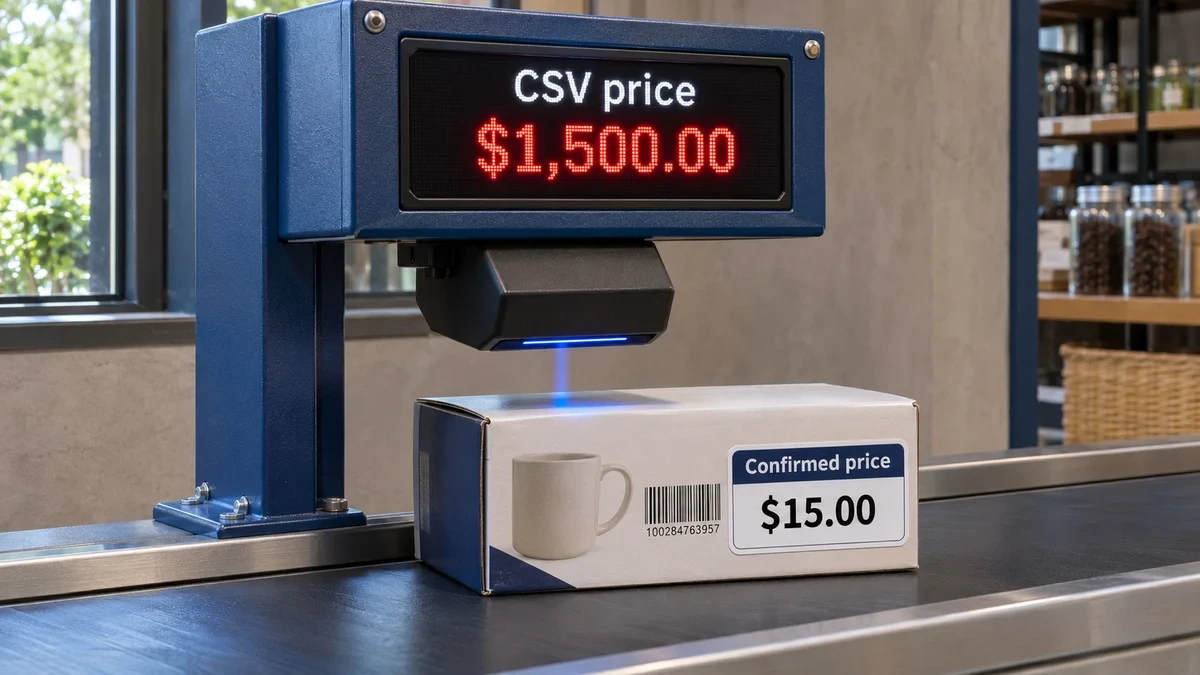
Flag outliers for review. An outlier is a value far from comparable entries. For example, A105 shows a mug priced at $1,500, while A104 shows the same product at $15.
Compare unit prices within each product. Show unusual prices with the order ID, the observed value, and the comparable rows. Do not change any price until I provide the source value.
In this example, the shop checks the original order and confirms that A105 sold for $15. Only then can the shop correct its analysis copy and log the change. If the shop can’t confirm the amount, mark the order unresolved and report how excluding it affects the totals.
Multiply units by unit price on each included row, then add those amounts by region.
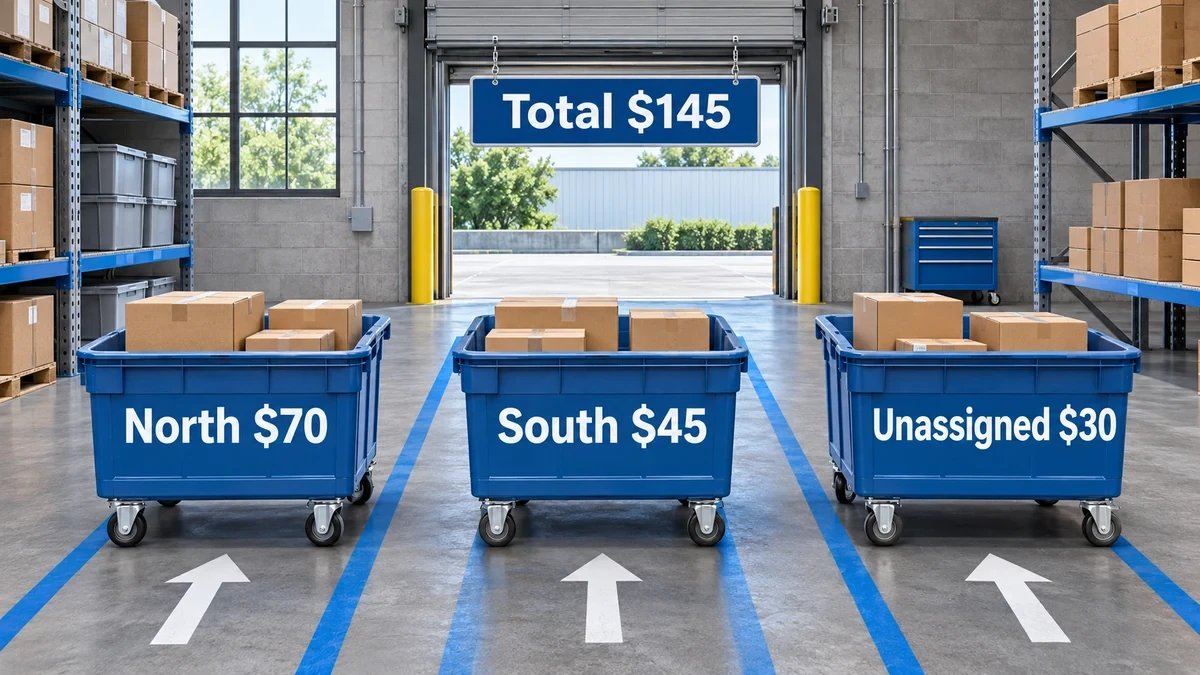
Use the cleaned rows and the confirmed $15 price for A105. Calculate gross sales as units × unit price. Show the included row count, units, and gross sales by region and overall. Keep Unassigned visible. Make a bar chart from those totals and show the source table.
The chart should show North at $70, South at $45, and Unassigned at $30. For AI data visualization over time, compare complete periods before describing a trend.
When you analyze CSV files with AI, recompute the numbers in a plain spreadsheet using the cleaned rows. If the six source columns are in A–F and the five included rows occupy rows 2–6, put gross sales in column G.
Or build a pivot table, which groups rows and summarizes their values. Put Region under Rows and Sum of Gross Sales under Values. Then confirm the pivot includes all five rows and uses a sum.
Show the code or formulas you actually used, along with the included row IDs, rejected rows, and grouping rules. If no code ran, say so and list the steps and cell ranges you used.
Check filters and ranges as well as arithmetic. Apply the same method you’d use to check AI answers against original evidence.
Choose by where your team can process the file and how you can inspect the results. Even if the upload succeeds, confirm the row count.
|
Tool |
Where It Works and What It Accepts |
Access to Check |
|
ChatGPT data analysis |
Upload CSV or XLSX into a chat. CSV and spreadsheet uploads are limited to about 50 MB, depending on row size. Upload limits |
Free and paid plans support uploads subject to limits and settings. Its hosted Python environment cannot make external web requests or API calls. Data analysis |
|
Claude file analysis |
Upload CSV or TSV to Claude’s hosted code environment. Anthropic lists 30 MB per file for this feature. |
Code execution is available on Free, Pro, Max, Ultra, Team, and Enterprise, subject to account or admin controls. Claude file analysis |
|
Copilot in Excel |
To analyze Excel data with AI in a cloud workbook, import the CSV and save it as XLSX. Python in Excel runs in Microsoft’s cloud. |
Check your Copilot license and Python in Excel availability separately. |
|
Gemini in Google Sheets |
Import the CSV into a native cloud sheet. Google lists up to 20 million cells or 100 MB for converted spreadsheets. Sheets limits |
Use an eligible Workspace or Google AI plan. You can inspect the analysis steps in the side panel. Gemini in Sheets |
Microsoft documented a Copilot Python skill for Insiders in August 2026. If it’s unavailable in your build, use regular formulas or enter Python in Excel yourself on a supported plan. For exact totals, choose AI spreadsheet analysis that gives you a reproducible calculation. Microsoft’s Excel release notes.
For secure AI data analysis, confirm the approved account and retention settings for both the file and the conversation.
Use a sample to design the method, a summary to draft a chart or explanation, and approved row-level data only when the question needs it.
|
If You Need To… |
Start With… |
Why |
|
Design a formula or cleanup rule |
Column names and synthetic rows |
Test edge cases without sending business records. |
|
Explain a pattern or make a chart |
A checked local summary |
The totals are enough to show the comparison. |
|
Investigate individual rows |
A minimized copy in an approved workspace |
The tool needs the affected records to show the exceptions. |
|
Keep the original file on your device |
Desktop Excel with a local file and plain formulas, or local Python with pandas |
Run the calculations where the file already lives. pandas CSV reference. |
The next time you analyze CSV files with AI, calculate one expected result locally, then use it to test the output. For weekly work, save the check alongside the analysis. How to build a repeatable AI workflow.
The import probably read them as numbers. Reimport the original column as text and check a few values against the raw file before using the IDs to match rows.
A sample can test your calculation. But for the actual ranking, calculate totals from the full eligible dataset locally or in an approved workspace.
Use it when your task is to ask questions about a set of sources. For a sales total you need to reconcile, start with the spreadsheet or code that will produce the number. How NotebookLM handles source-based research.
Save the chart and formulas in a workbook. When you need to move the row values between tools, export a separate CSV.





1 Comment
[…] using a synthetic sample to get help with a spreadsheet, then running the calculation locally. Our guide to analyzing CSV files without exposing sensitive data walks through that […]